30 Dec Bali surf tours or folowing a tide chart
Most of us know about low and high tides from school. Water in the ocean changes from a high tide to a low tide a few times a day (at some locations just 1). But it’s well known facts from basic education program, and no one told us what is the connection between tide level and Bali surf tours, surfing in general. Let’s figure out what a tide chart depends on and what influence it has on Bali surf tours destinations.
Factors that effects on a tide level

The answer is pretty clear and simple – the Moon and the Sun. Since the Moon is closer to the Earth, its influence is way more significant. Gravitation of the Moon and the Sun forms 2 large tidal waves from the Moon and its opposite side. These waves follow the Moon and make a full rotation in 24 hours and 48 minutes. So let’s count – 2 waves and 1 day will be equal 2 high tides and 2 low tides. During full or new Moon level of water in the ocean rapidly changes because both the Sun and the Moon are within the same distance from our planet, so this combination has more influence. Full Moon or new Moon are not the best days for Bali surf tours because the level of water is constantly changing and it’s getting hard to read its behaviour. Some surf spots still work fine but some of them you are better to avoid.
What’s connection between Bali surf tours and tide chart and how to ‘read’ the last?
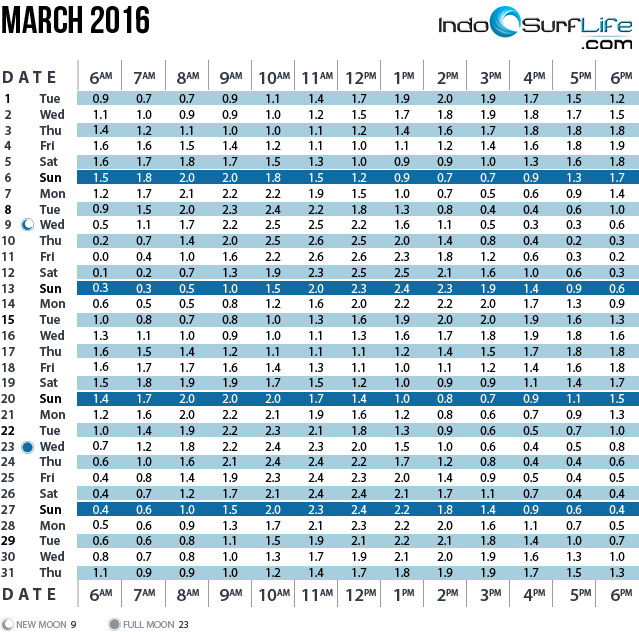
Tide level has a direct impact on surfing and Bali surf tours. But don’t forget that every surf spot has different conditions for good waves for surfing. Every surf spot is unique and before you’re going somewhere first check the best time for the place you want to go to. At the same time don’t forget to check tide and swell charts, so when you combine your wishes with current whether you’ll hardly regret your choice. You know, forewarned is forearmed. For checking a tide you don’t have to go to the courses to learn how to make it – surfing nerds took care about that for every surf spot on this planet. And more good news, that tide chart is not something super complicated that can only be read only by surfing genius. This is jist an example, that we’ll keep updated as soon as new one will be released!

How to use a tide chart?
You can see dates of a month in the left column, on top graph – the time. So in the cross of it is the forecast of a tide level, pretty simple, isn’t it? PS: sometimes it can be measured in metres of foot (about of 0,3048 metres).
Don’t be confused!
- Some people after their first lessons more then sure that high tide is the best time to go surfing. Oops, but it doesn’t always work out. Like we said above, every spot is unique and has its own conditions for perfect surfing, make sure you know all the information you need about a surf spot.
- Tide chart and swell chart are different things. Yes, sometimes the higher a tide the bigger are waves, but it depends on spot. Just keep in your head – swell chart and tide chart are two different things. To check a swell chart just visit the following websites:
Maybe at the start it can be confusing, but our surf instructors are more than happy to explain how to read these charts and will pick up good surf spots for your level!


